Why? In all Motion versions up to 4.3.0, we only dealt with influence. That means if you changed the speed graph, it would update the influence of your selected keyframes, and reset the speed to 0. We decided that keeping this functionality on the Home Page would be less confusing, and allow users to use the speed graph the 'classic' way. To use the new functionality, all you'd need to do is go over to the Easing Page.
Usage
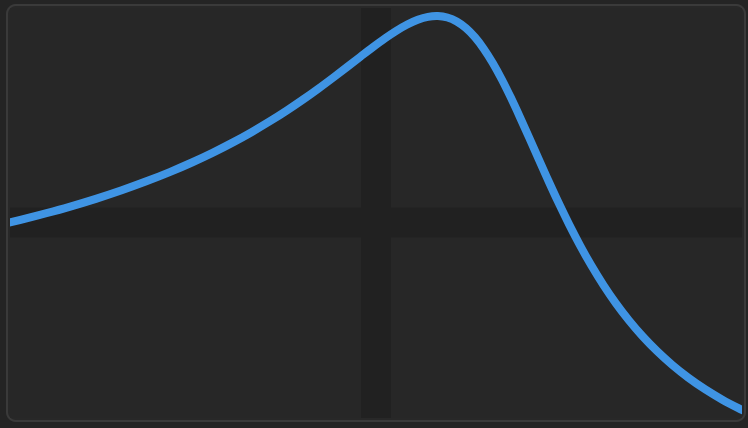
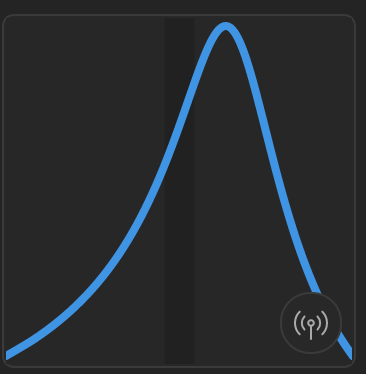
The Speed Graph is meant to show the speed of an object between two keyframes. From left-to-right, it shows the speed of a layer coming out of the first keyframe, easing in to the second keyframe.
Dragging the speed graph functions the same as on the Home Page. It adjusts the influence of the keyframes. When you stop dragging, these values are applied to your selected keys.
Now that we are incorporating keyframe speed (in addition to influence), the speed graph may show some more interesting curves than what you're used to. For example, the first screenshot on this page shows the speed crossing into the negative area as it eases in to the second keyframe. If this was for X Position, for example, it would show some overshoot.